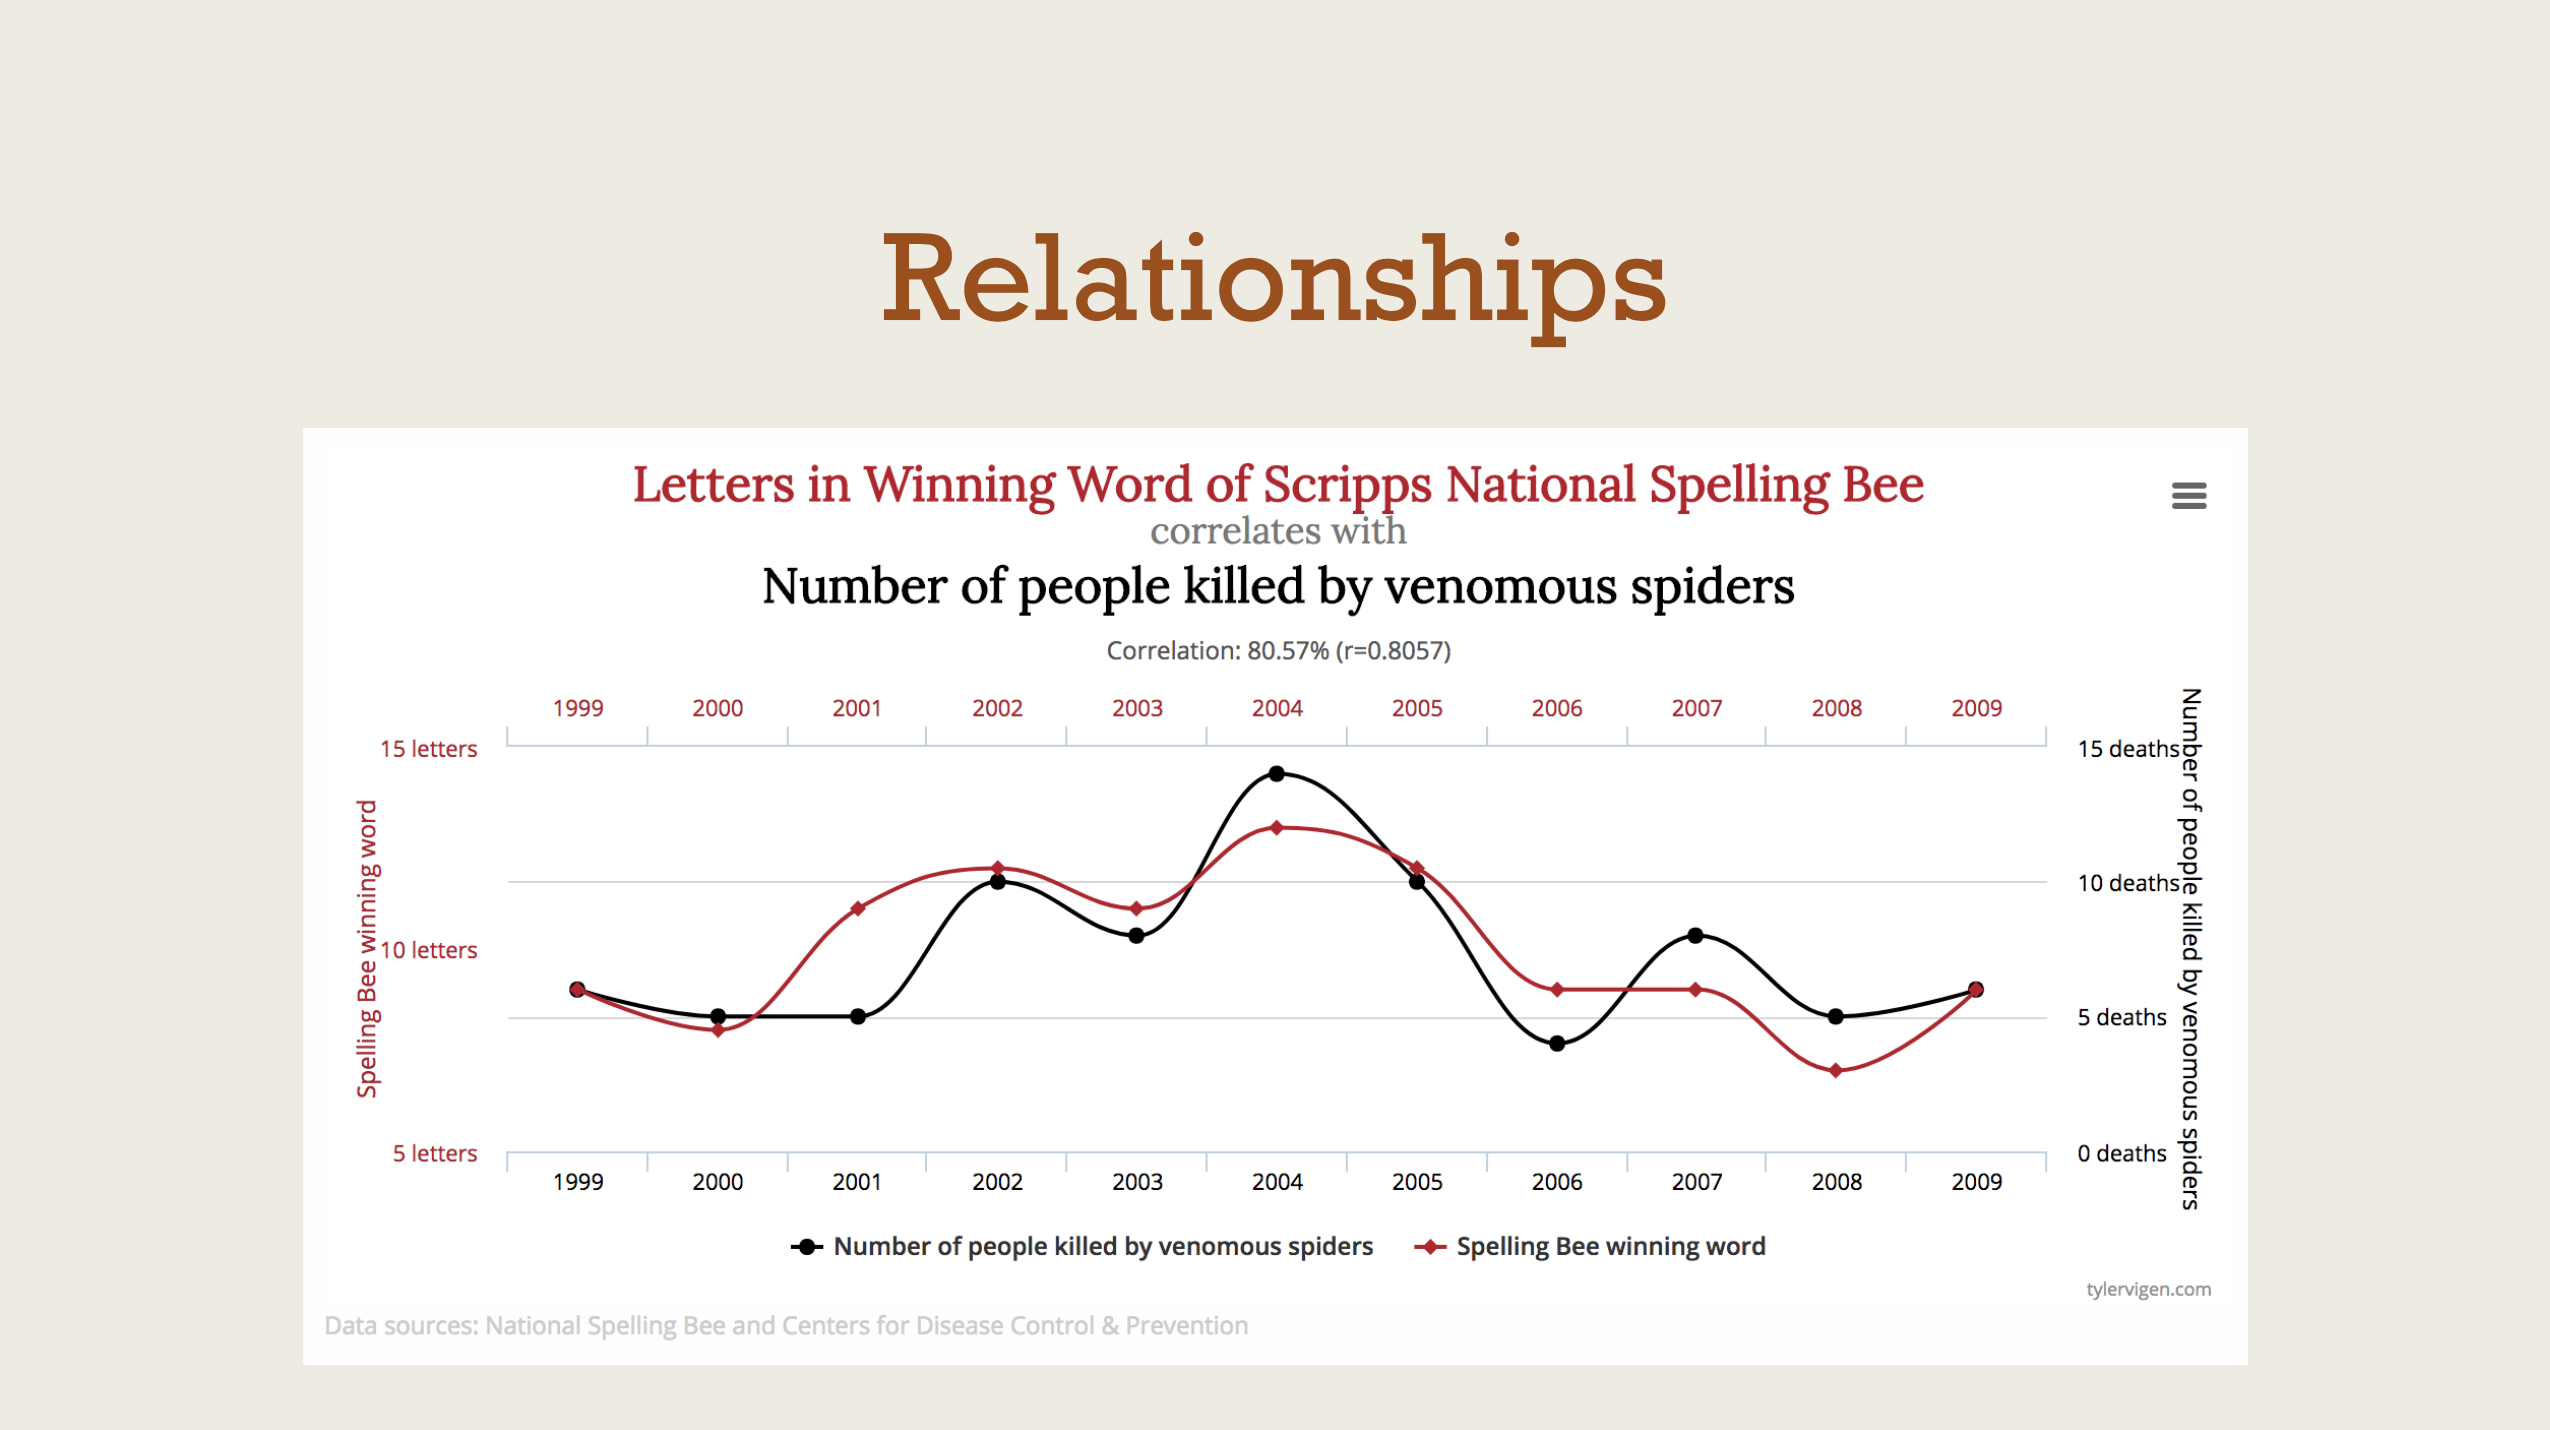
Relationships
Materials for class on Tuesday, September 26, 2017
Contents
Slides
Download the slides from today’s lecture.
Miscellaneous R stuff
Download Comic Relief data and place it in a folder named data in your project: Comic Relief 2015–2016 grants
Searching for code on GitHub
GitHub is an excellent source of real-world code, and it’s easy to search for examples of things other people have written. Use the advanced search to limit the search language to R.
Installing packages from GitHub
Not all R packages are hosted on CRAN—many are repositories that live on GitHub. It’s possible to install packages from GitHub, but you can’t use RStudio’s “Packages” panel. Most non-CRAN packages will include instructions of how to install (such as this package for ridge plots), but the general syntax is this:
library(devtools)
install_github("username/repository_name")

# Or, in one line
devtools::install_github("username/repository_name")

# So, in real life, you can do this:
devtools::install_github("clauswilke/ggridges")
devtools::install_github("andrewheiss/reconPlots")
Pipes (%>%)
Pipes let you concatenate nested functions in a human-readable form and can make it a lot easier to understand your code:
library(tidyverse)

# Create a bunch of numbers
x <- rnorm(1000)

# Nest some functions
round(mean(x), digits = 2)
sqrt(var(x))
round(sqrt(var(x)), digits = 2)

# Use pipes to make nested functions easier to read and write
x %>%
  var() %>%
  sqrt() %>%
  round(digits = 2)
Pipes are even more helpful when manipulating data frames. For instance, typically it’s best to load the raw data as a data frame, clean it with a chain of functions, and then save it as a separate data frame:
library(tidyverse)
library(readxl)
library(lubridate)

cr_raw <- read_excel("data/ComicRelief_360Giving_International.xlsx")

cr <- cr_raw %>%
  rename(amount = `Amount Awarded`,
         duration = `Planned Dates:Duration (months)`,
         program = `Grant Programme:Title`,
         award_date = `Award Date`) %>%
  # year() comes from lubridate and it extracts the year from a date object
  mutate(award_year = year(award_date)) %>%
  # as.factor() converts values to categorical variables
  mutate(award_year = as.factor(award_year))
Working with ggplot objects
You can save the output of a ggplot plot to an object (p1 here):
# Get rid of the largest grants
cr_filtered <- cr %>%
  filter(amount < 3000000)

p1 <- ggplot(cr_filtered, aes(x = duration, y = amount)) +
  geom_point(aes(color = award_year)) +
  scale_color_manual(values = c("green", "brown")) +
  geom_smooth(method = "loess", color = "#274981") +
  geom_smooth(method = "lm")
p1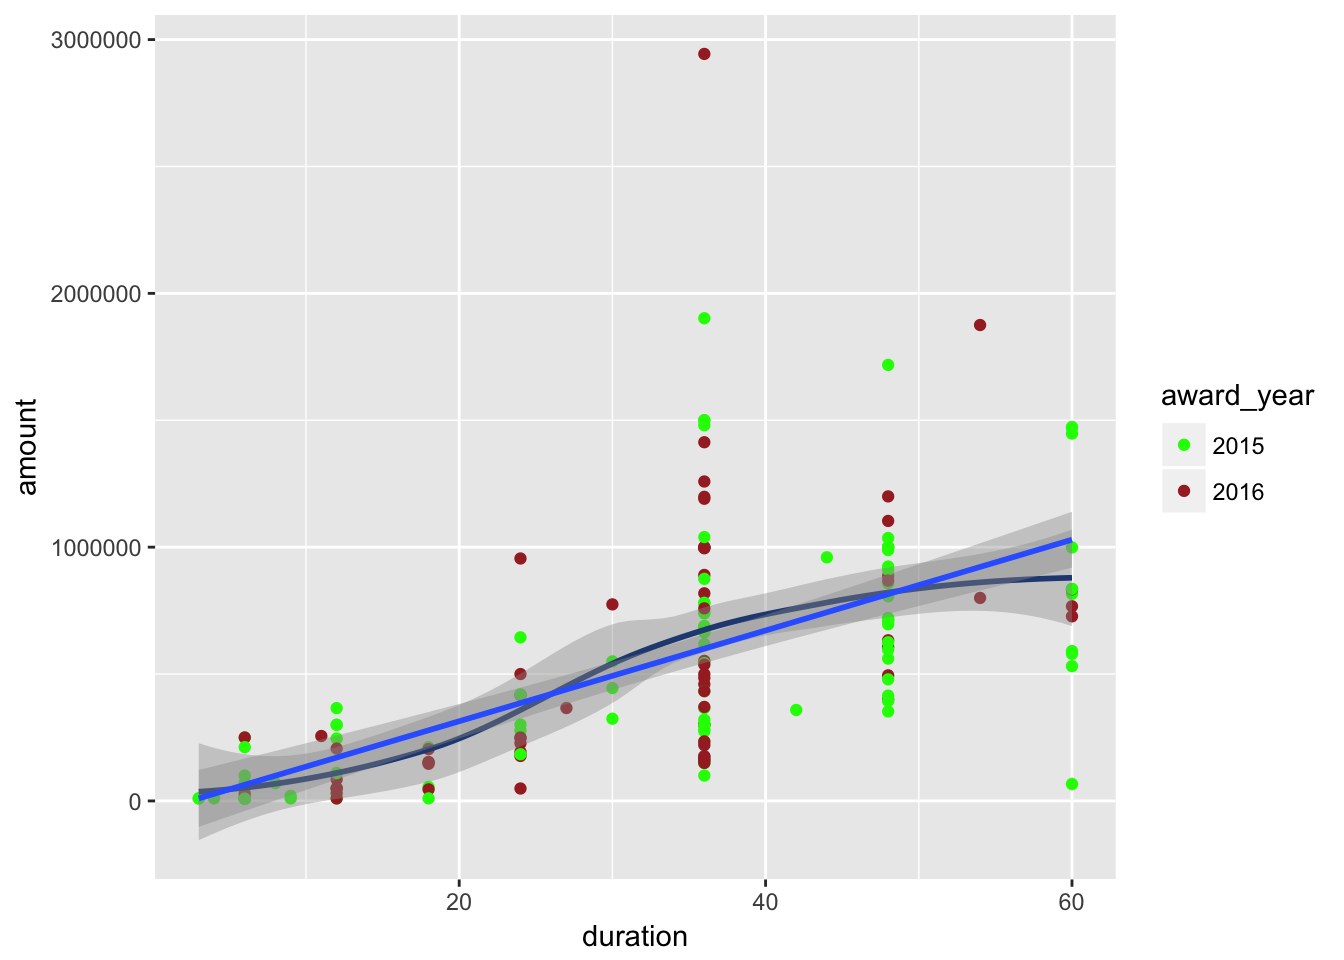
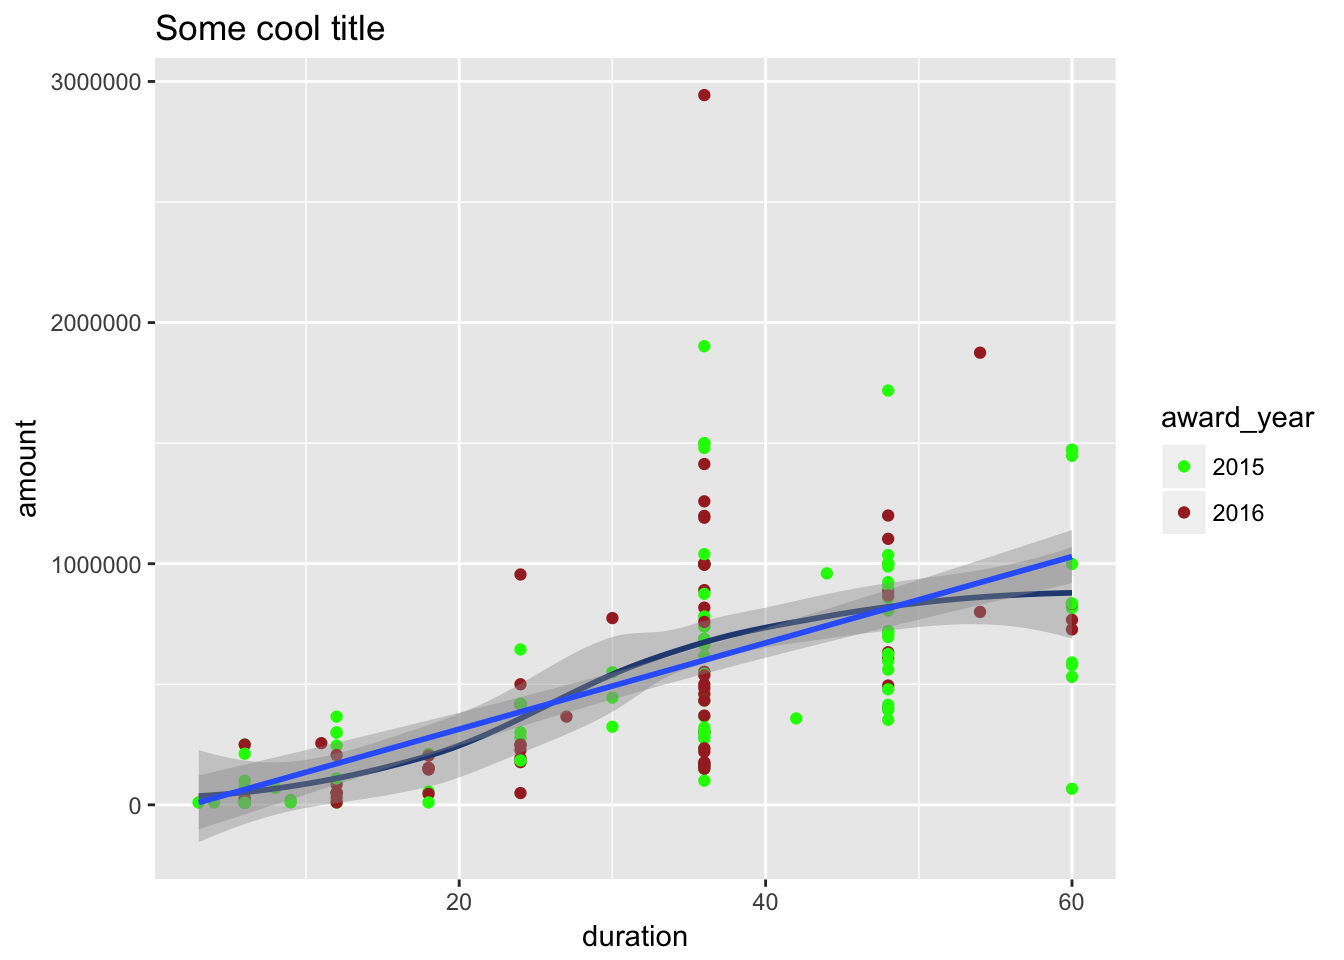
When you save ggplot plots as objects, you can do fun things with them, like add additional layers without repeating all the code from the base plot:
… or saving the plot to your computer:
ggsave(p1, filename = "plot1.pdf")
ggsave(p2, filename = "plot2.png", width = 5, height = 7, units = "in")
ggsave(p3, filename = "plot3.pdf", width = 5, height = 7, units = "in")
# etc.
… or arranging multiple plots:


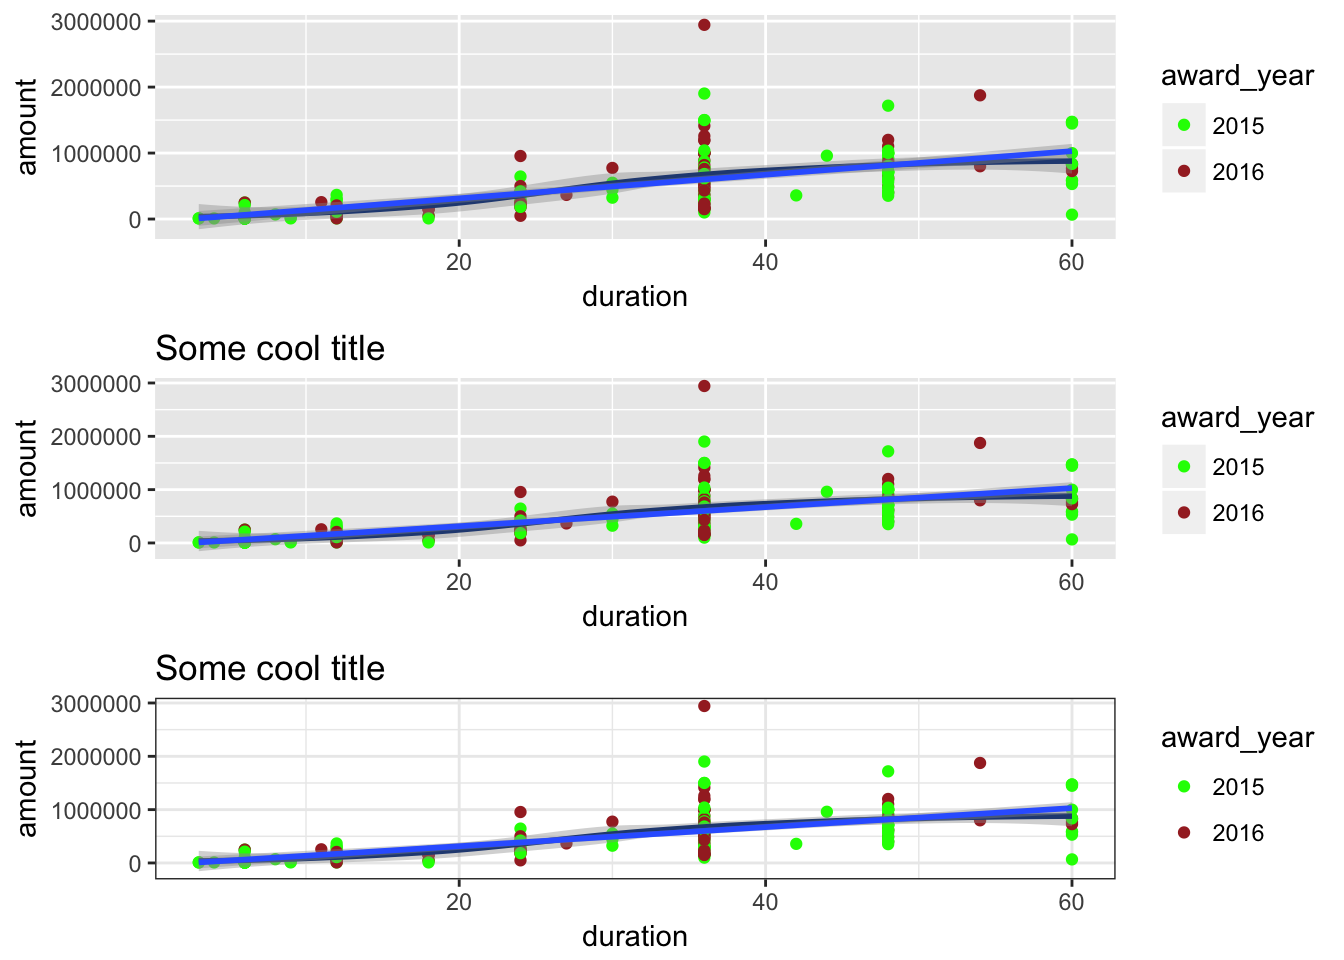
If you want to save one of these combined plots to an object, you need to use arrangeGrob() instead of grid.arrange():
If you want to plot a saved arrangeGrob object, you have to use these two functions:
grid::grid.newpage()  # Clear out whatever plot is there already
grid::grid.draw(p_lots_of_them)  # Draw the combined plot
Fonts
It’s relatively easy to use custom fonts in ggplot plots, but there are some tricks. Read this post for more details and for instructions for how to do it on macOS and Windows.
Colors
You can specify colors in R in a few different ways:
- R has hundreds of built-in named colors, listed here I typically don’t use these, except for the
greyXXcolors, since it’s easier to use something likec("grey30", "grey60", "grey90")to get a series of greyscale colors than looking up their hex codes.
- You can use hex codes (
#203864,#DC5B44, etc.) or RGB values (rgb(0, 146, 255)) - You can use special scales that draw on fancy algorithms and hand-picked color palettes, like Color Brewer and Viridis
library(viridis)
ggplot(cr_filtered, aes(x = duration, y = amount)) +
  geom_point(aes(color = as.factor(program))) +
  scale_color_viridis(discrete = TRUE)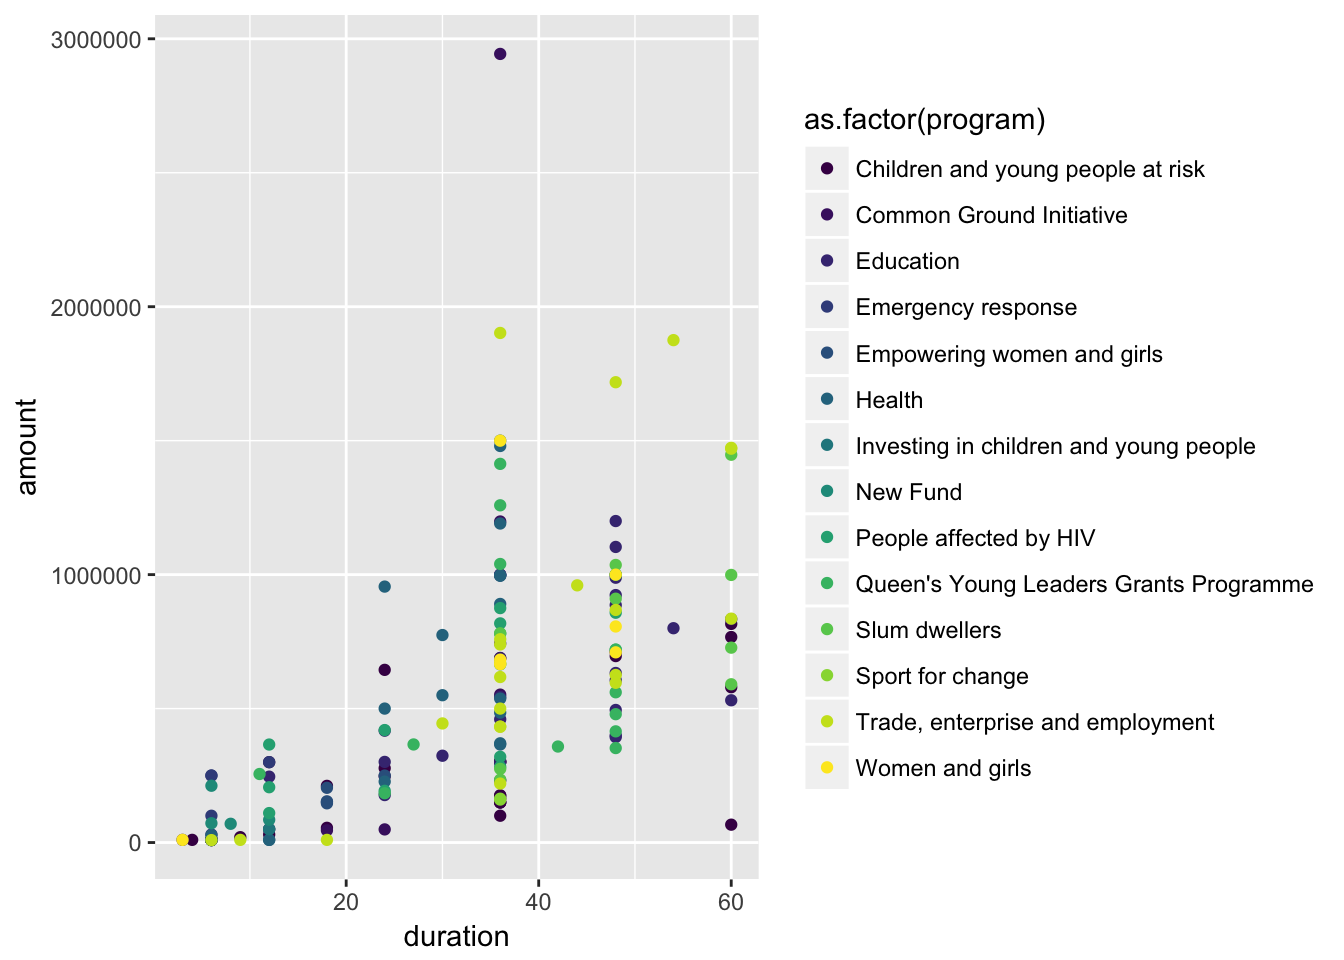
ggplot(cr_filtered, aes(x = duration, y = amount)) +
  geom_point(aes(color = as.factor(program))) +
  scale_color_brewer(type = "qual")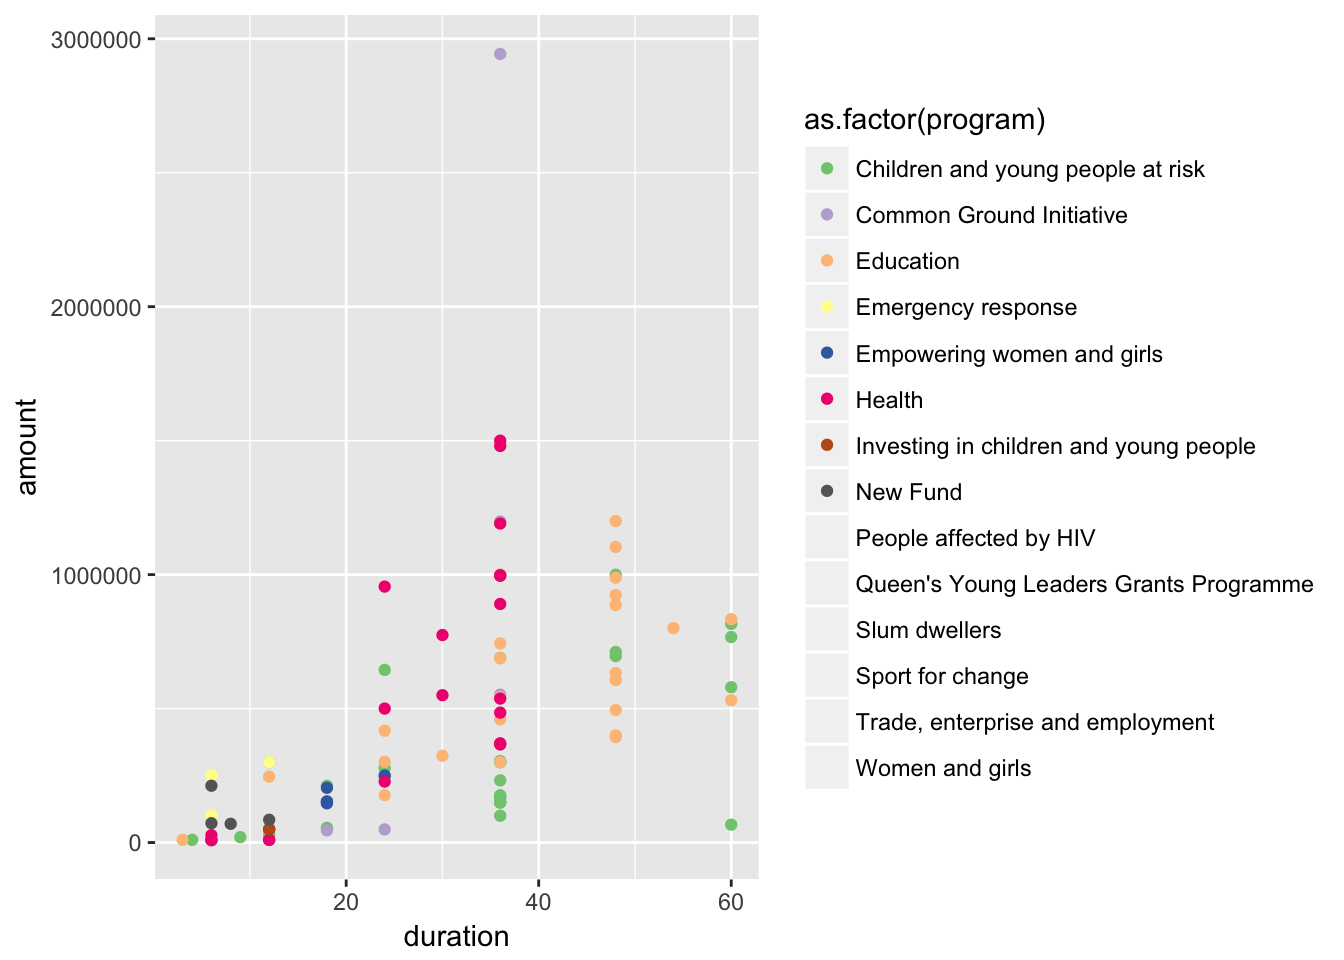
ggplot(cr_filtered, aes(x = duration, y = amount)) +
  geom_point(aes(color = as.factor(award_year))) +
  scale_color_manual(values = c("#203864", "#DC5B44"))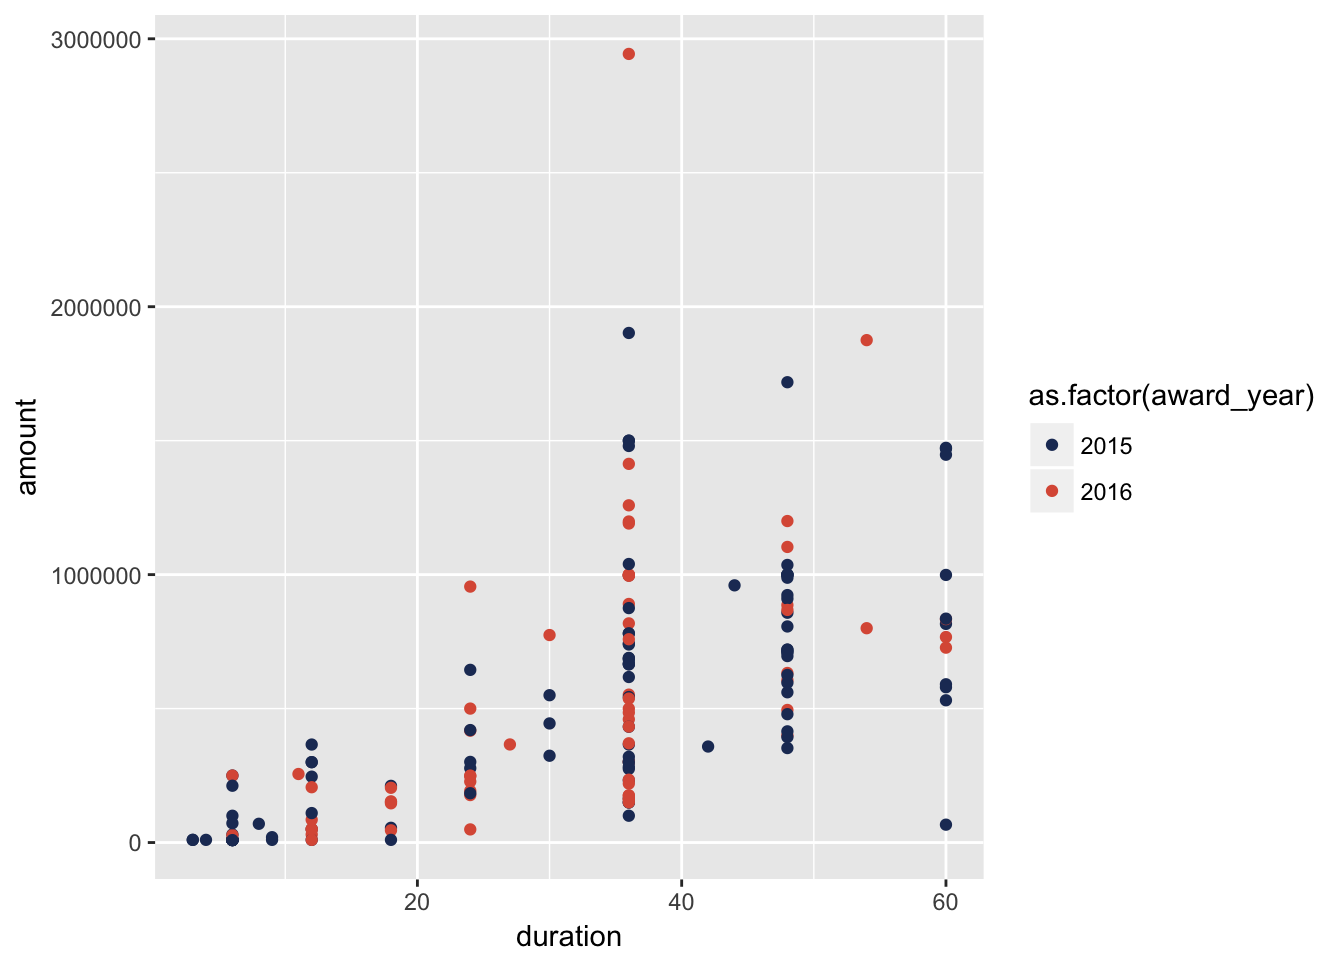
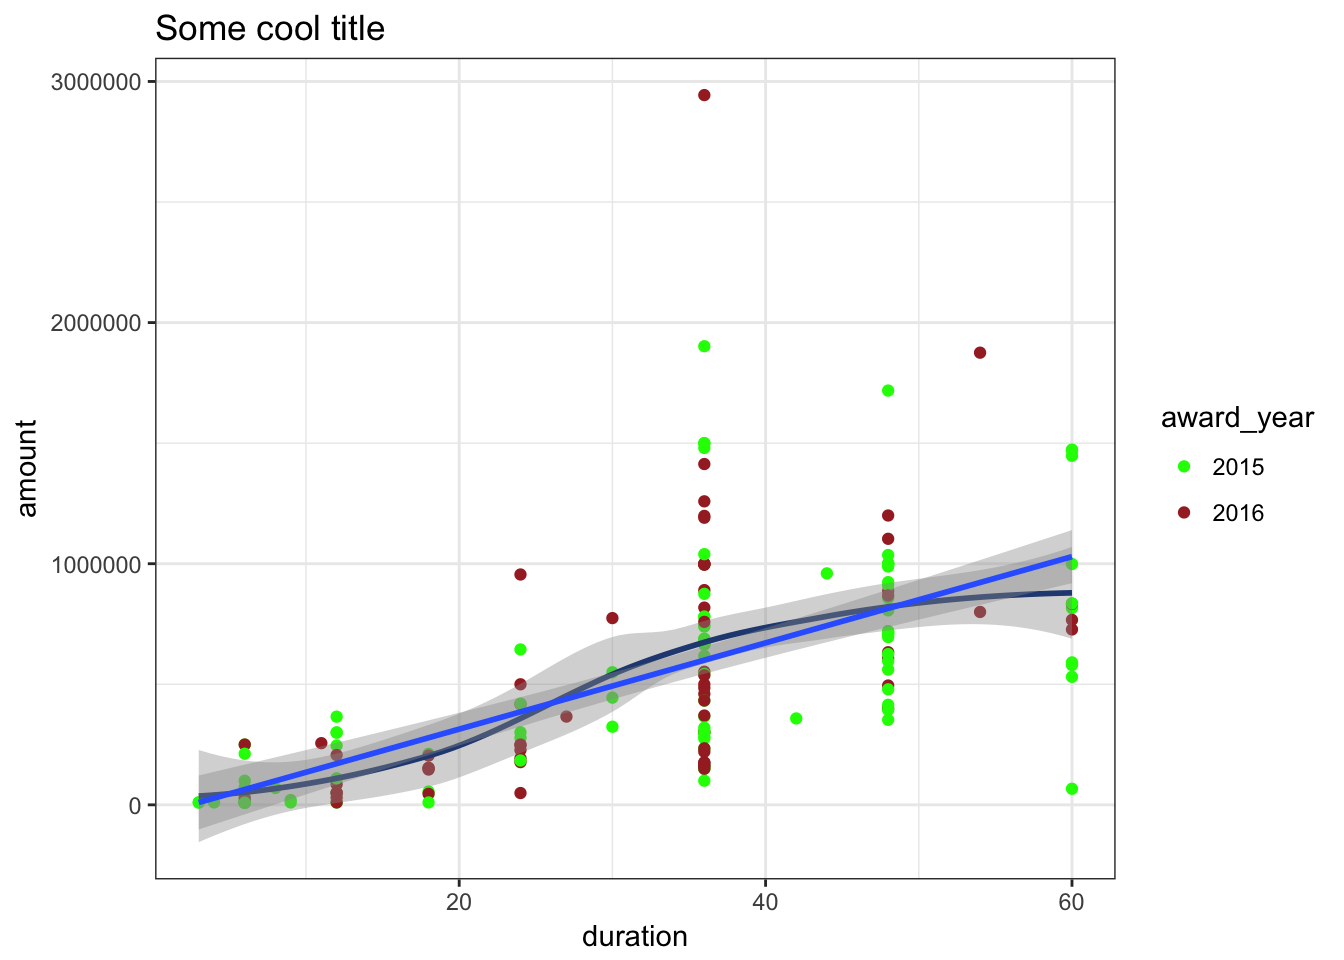
Theme options
You can make adjustments to plots with the theme() function, but there are a billion different options to play with. To simplify life, you can install a GUI interface for manipulating themes with the ggThemeAssist package. Once it’s installed, you can access it in RStudio with the “Addins” menu at the top of the window. You must have a ggplot object selected for it to work.
ggThemeAssist will generate a bunch of settings inside a theme() function. If you want to reuse those settings in other plots, you can assign them to a variable and then add that variable as a layer to other plots:
# This was all generated with ggThemeAssist
my_ugly_theme <- theme(axis.text.x = element_text(angle = 45),
                       panel.background = element_rect(fill = "darkgoldenrod1"),
                       plot.background = element_rect(fill = "antiquewhite"),
                       legend.background = element_rect(fill = "hotpink"),
                       legend.position = "bottom", legend.direction = "horizontal")

p1 + labs(x = "Months", y = "Amount", title = "Cool stuff") +
  my_ugly_theme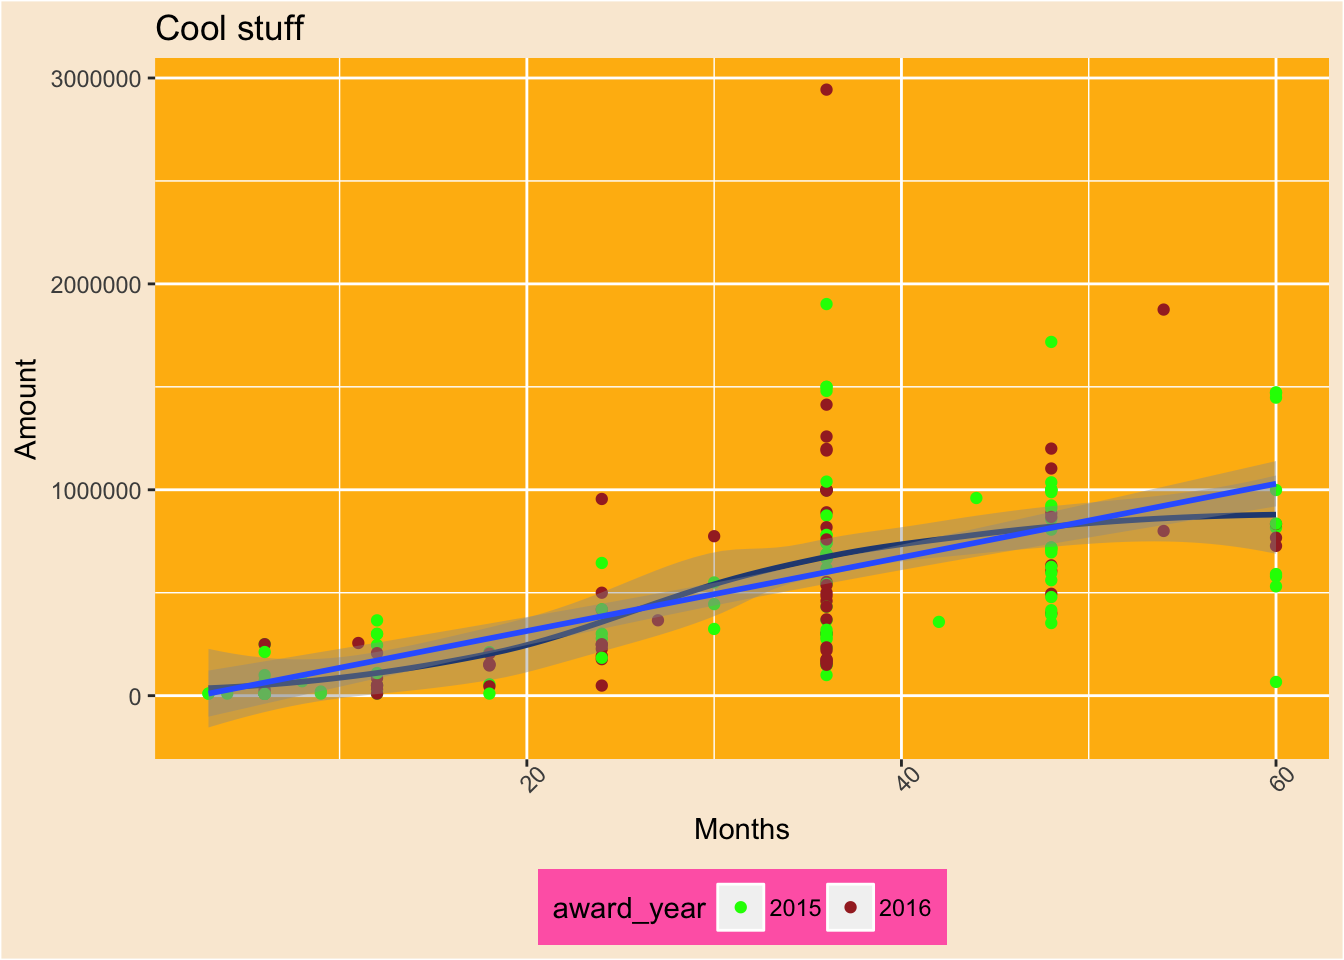
Feedback for today
Go to this form and answer these three questions (anonymously if you want):
- What new thing did you learn today?
- What was the most unclear thing about today?
- What was the most exciting thing you learned today?