Draft rubric
Due by 11:59 PM on Monday, September 25, 2017
Evaluating data graphics is hard, especially since so much of the work that goes into creating excellent visualizations is subjective. How do you know if a figure follows graphic and data design principles and communicates truth?
Over the course of the term, you will develop your own rubric for evaluating the design, aesthetics, correctness, and truth of data visualizations, based on the readings, assignments, and classroom activities you’ll do. These rubrics can take any form you want, as long as they include some approach for scoring performance and some method for quickly identifying specific areas of improvement. Where possible, try to cite the materials you draw from to create the rubric items.
So far, you have read enough about the foundations of data visualization to get started on your rubric. For this assignment, you will create a draft rubric. E-mail me a PDF version of your rubric by midnight on Monday, September 25. I will then shuffle the rubrics and send them to two people in the class—you will each provide feedback and comments for two other rubrics.
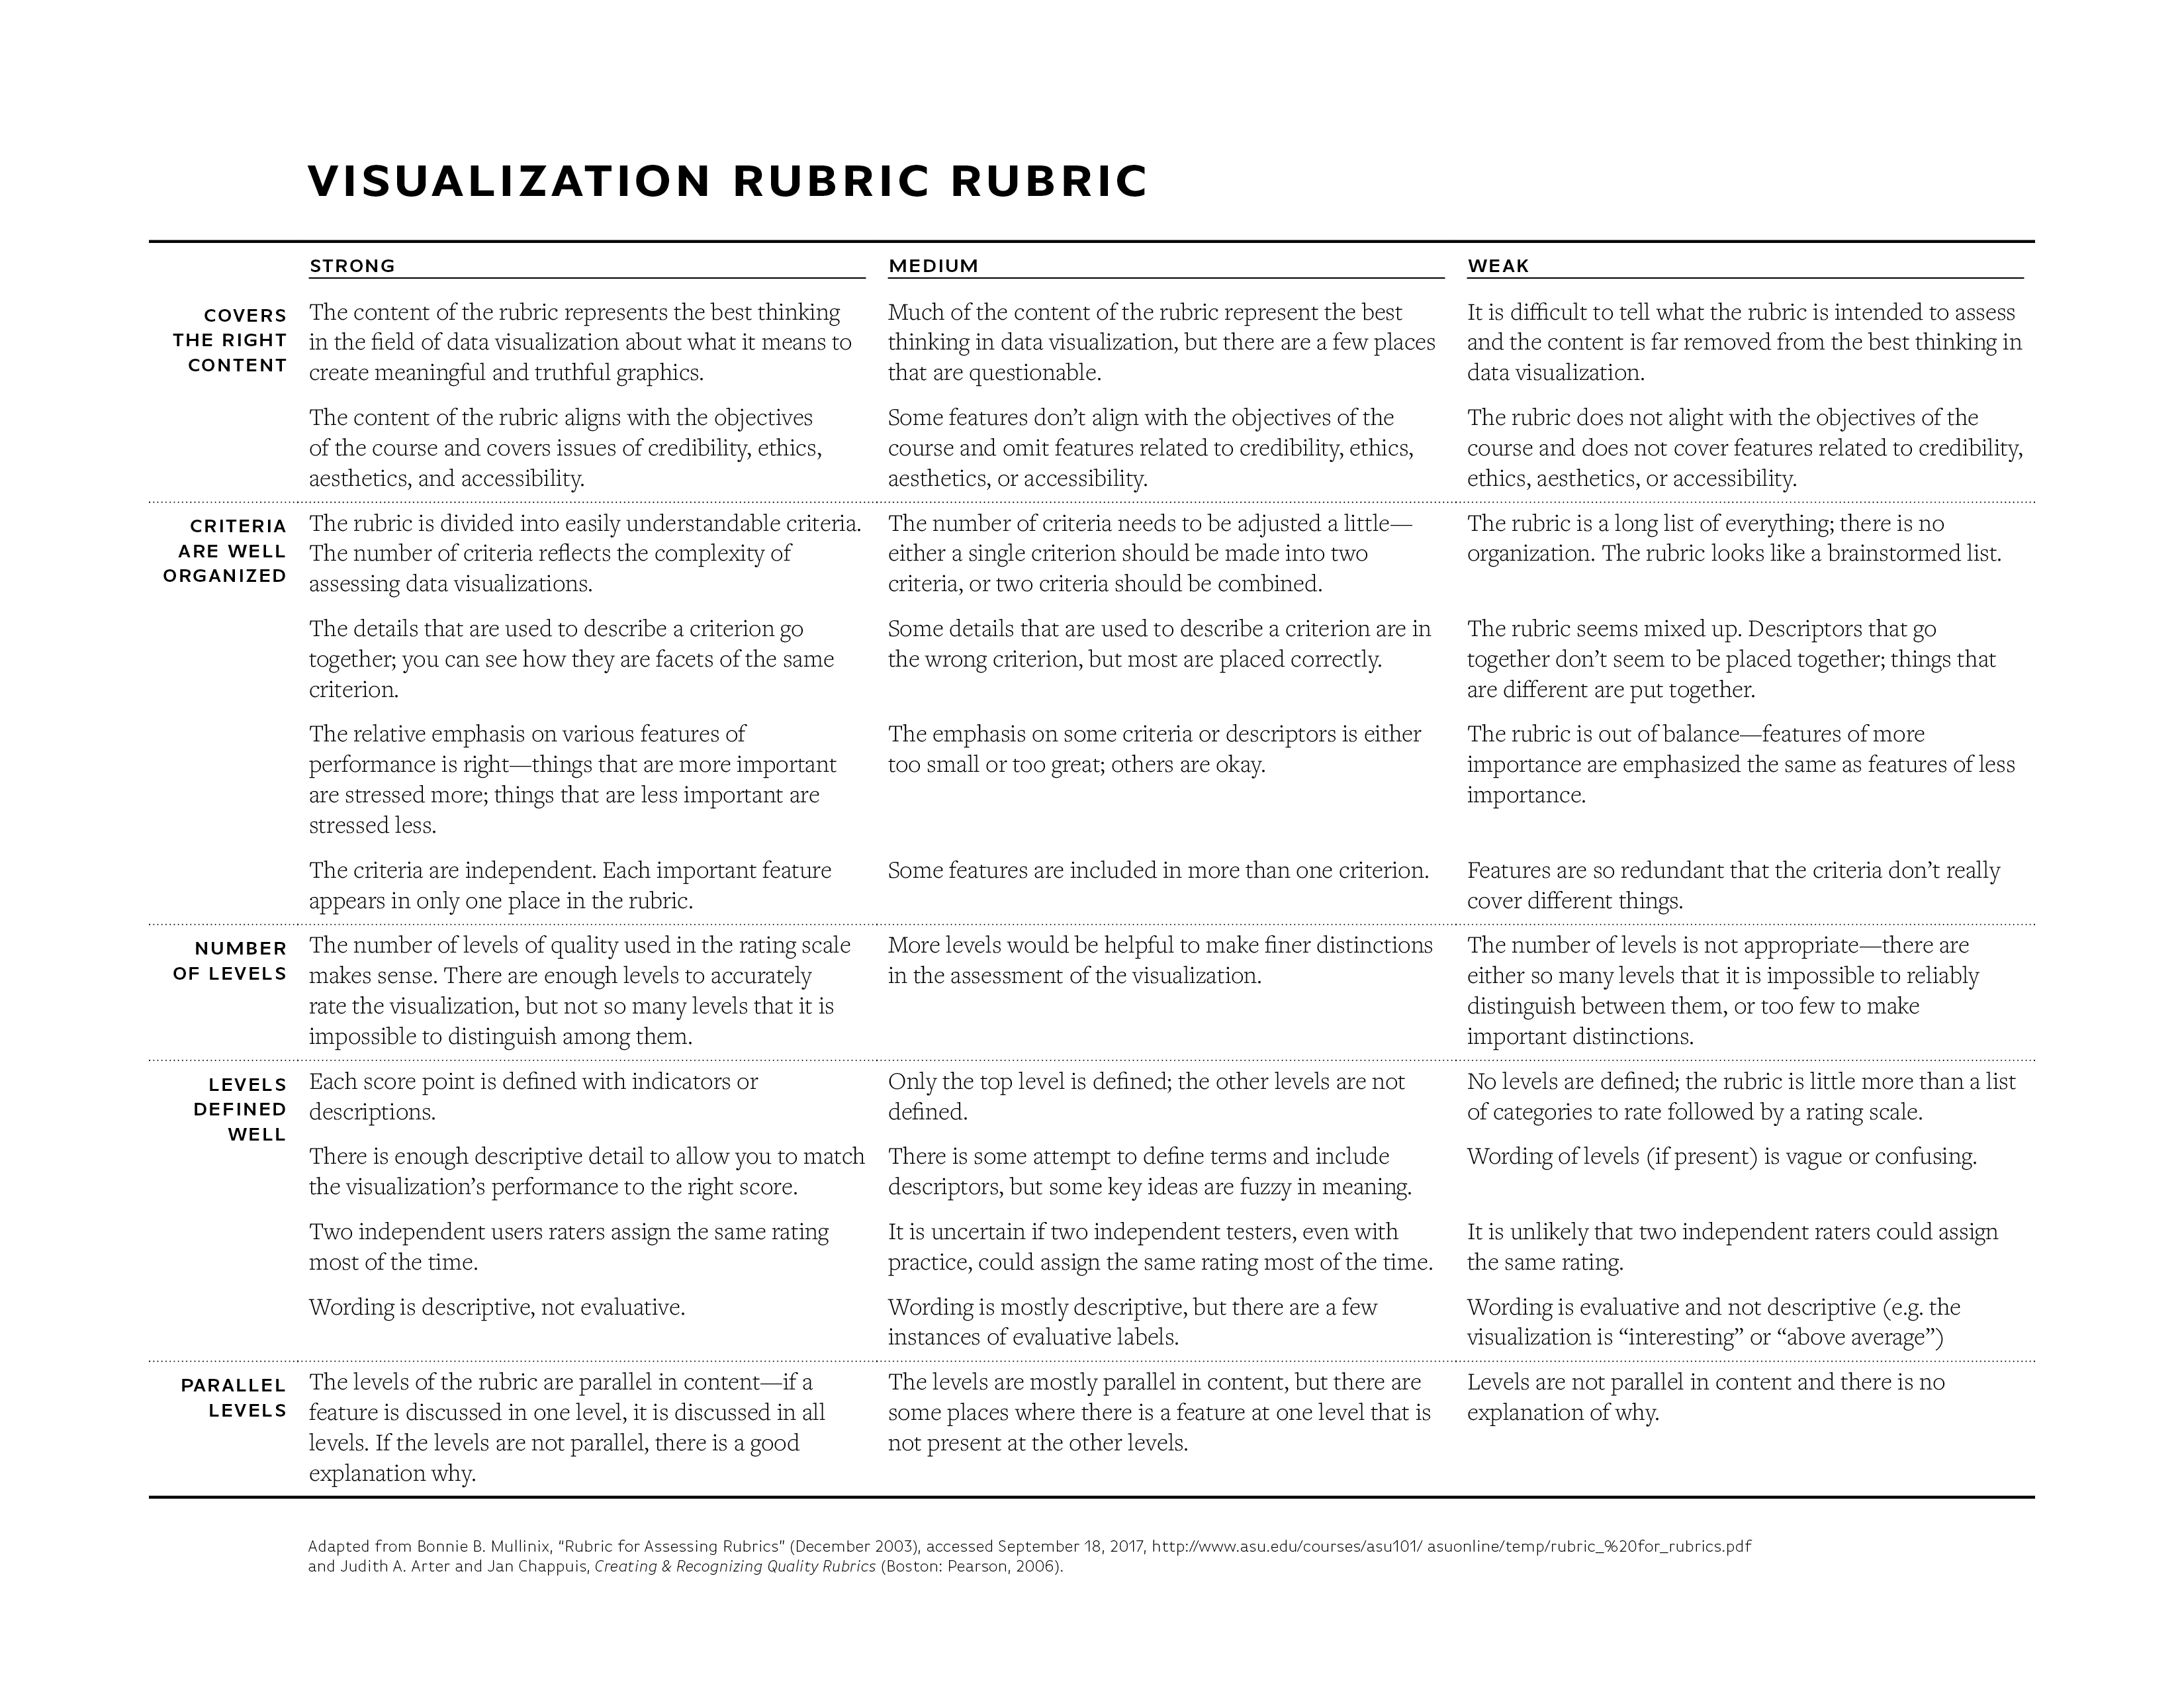
I will grade your final rubric with this rubric of rubrics, so keep these guidelines in mind as you work on yours.

You will only be graded for completion, but please do your best, since you’ll get better feedback from me and from your peers if we can see an as-complete-as-possible version.